A map · a place · a decision
Astrocartography Chart Example: From Lines to Places
In this astrocartography chart example, Orlando leads overall but carries relationship caution. Winnipeg leads for Home. Follow the evidence behind those different answers, then generate your map to explore your own places.
Begin with your own birth details
Start with the free map. Deeper readings, complete reports, and full comparisons follow your plan’s access. See what is included.
The demonstration chart
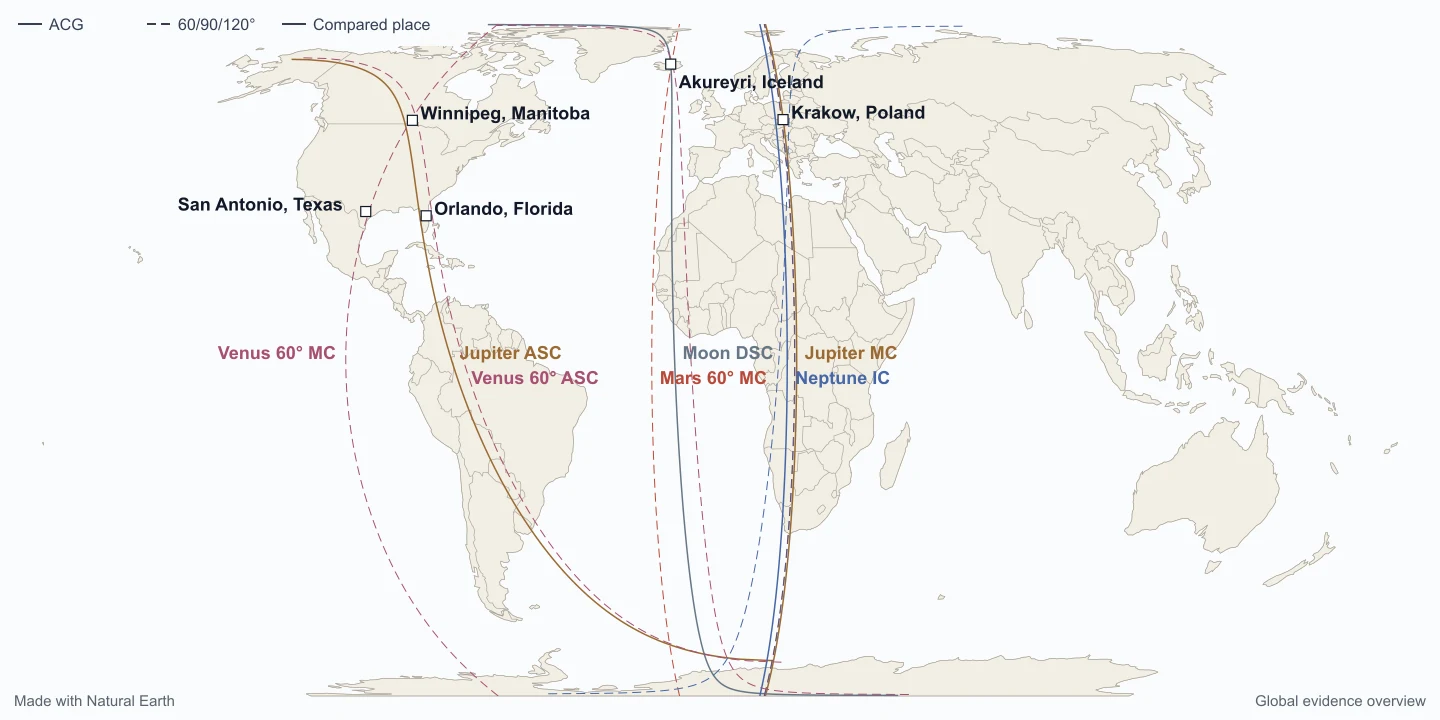
01 / The whole chart
Orlando leads overall. Home points to Winnipeg.
This astrocartography chart example uses synthetic birth details: June 15, 1990, 08:15, New York. Orlando leads the five-city report overall, with its strongest support in Home and community. Yet all five themes remain mixed, and relationships carry its greatest caution. The map shows selected evidence behind that comparison, rather than a customer story.
Which priority changes the shortlist?
A solo move, a shared home, and a work relocation ask different questions of the same chart. Compare the goal-specific leads before choosing which places to investigate.
Which parts of the map explain that answer?
City markers identify the compared places in this astrocartography chart example. The Orlando close-up connects numbered signals to their distances and interpretations.
For the four angles, see astrocartography line meanings; for the general method, see the map reading guide.
02 / One place, three signals
What changes when you look closely at Orlando?
The Orlando close-up in this astrocartography chart example marks three calculated signals. Their numbers match the explanations, and their distances come from the calculation rather than an estimate from the picture.
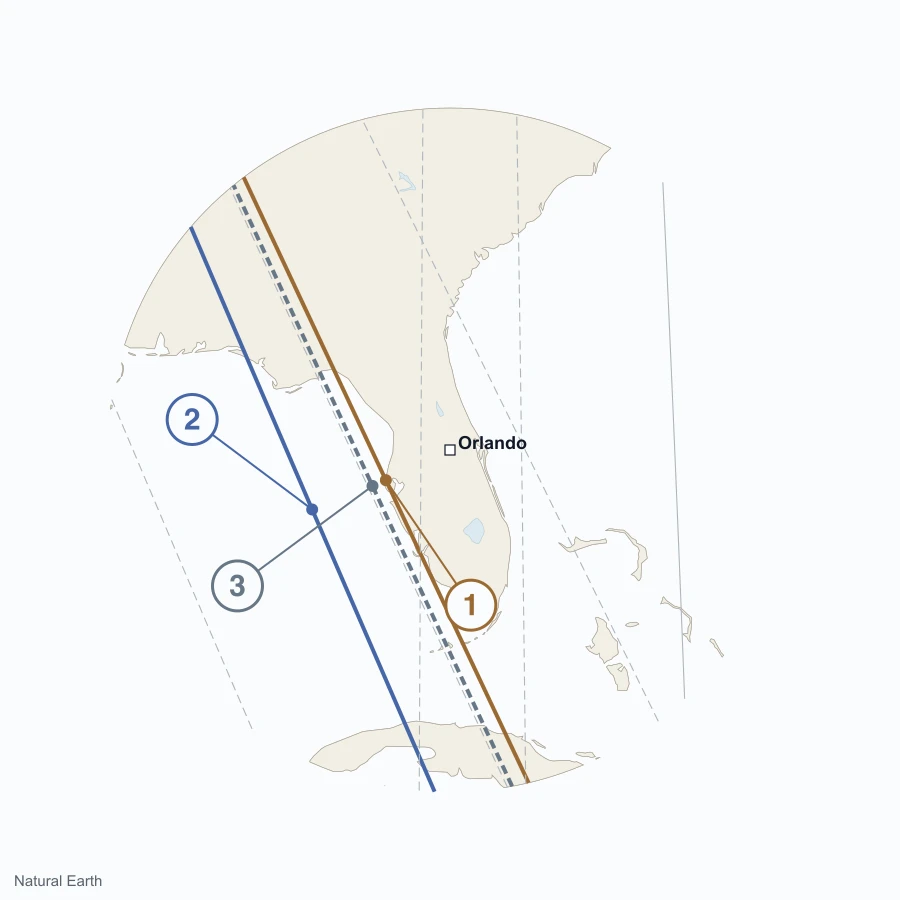
Jupiter · ASC
155.5 km from Orlando
Growth and exploration.
Neptune · DSC
329.2 km from Orlando
Relationship boundaries.
Moon · ASC · 120°
187.3 km from Orlando
Contributes to home support.
Jupiter–ASC contributes growth and exploration. Neptune–DSC raises idealization and unclear relationship boundaries. Looking only at the growth signal would leave out the partnership question a shared move needs to address.
Moon–ASC 120° contributes to Home support in this astrocartography chart example. It is an aspect line, not ordinary Moon–ASC or Moon–IC. Keep that calculated identity alongside its home-related interpretation.
03 / From evidence to a judgment
Support for a new base. A relationship question still open.
Support for settling in, with relationship trade-offs
Orlando’s reading in this astrocartography chart example raises two questions for a shared move: what supports building a base, and what relationship expectations need discussing?
Home and community have Orlando’s strongest support. The Moon–ASC trine and Venus–ASC sextile contribute to this theme, while Jupiter–ASC adds growth and exploration. Together they make building a base worth investigating, alongside the relationship cautions.
Relationship caution is higher here than in San Antonio. Neptune–DSC adds idealization and unclear boundaries, so Orlando’s overall lead does not mean it leads for partnership. Check whether the promise of a new home matches both people’s expectations.
Both Home verdicts are high-confidence but mixed in this astrocartography chart example. Confidence concerns evidence breadth, birth-time stability, and house-system agreement; it does not make the place entirely supportive.
Orlando’s Home explanation also retains a Moon–IC / Mercury–DSC Paran conflict, separate from the numbered Moon aspect line. The three highlighted signals do not exhaust the verdict’s evidence.
Test this during an ordinary workweek: does belonging persist through routines, and do both people agree about space, responsibilities, and expectations?
04 / Same chart, different questions
Why doesn’t one city lead for everything?
The birth details and five cities stay fixed in this astrocartography chart example. Career points to Akureyri, relationships to San Antonio, and Home to Winnipeg. Each lead retains a caution relevant to that choice.
| Question | Lead city | What the result retains |
|---|---|---|
| Overall balance | Orlando | Orlando leads this overall comparison, yet all five themes combine support and pressure. Home and community have its strongest support; relationships carry its greatest caution. |
| Career | Akureyri | Leads this comparison for career. Mercury–MC supports communication and public-facing work; wellbeing carries this city’s greatest caution. |
| Relationships | San Antonio | Leads for relationships and travel. Relationship caution is lower than in Orlando, while career is this city’s most pressured theme. |
| Home | Winnipeg | Leads for home and wellbeing, with Moon and Venus aspects contributing to home support. Orlando leads overall: a home-first choice can differ from an all-round choice. |
Orlando or Winnipeg for a home-first move?
The two Home readings in this astrocartography chart example share Moon–ASC trines and Venus–ASC sextiles, yet retain different pressures. Orlando’s primary Home support is the Moon–ASC trine at 187.3 km; its main trade-off is Uranus 90° to MC at 156.9 km. Winnipeg’s Moon–ASC trine is 164.8 km away, with Neptune–DSC at 223.9 km as its main trade-off.
Winnipeg leads for Home while both cities remain mixed. The report does not attribute its lead to the shorter Moon distance alone; shared Moon support does not erase the differing cautions.
For your own shortlist, put the home theme beside any work or partnership constraint that could change the move. This makes the comparison about what you would need to manage in each place, as well as what seems supportive.
A career-focused astrocartography chart example
Krakow’s Jupiter–MC line is only 3.9 km away, yet career remains mixed: Neptune 90° to ASC is 135.3 km away, and the report retains a Pluto 120° to MC conflict. Proximity to one promising line does not make it the career leader.
Akureyri leads for career but is also mixed. Its career explanation places Jupiter 60° to ASC at 207.3 km beside Mars 60° to MC at 13.6 km as a trade-off. The nearer signal is the caution in that explanation. Choosing between these cities requires weighing the complete readings, rather than chasing the smallest distance to a favorable planet.
Bring your current city and a realistic alternative to your map, with one priority in mind. A work move and a shared home may produce different shortlists from the same birth details.
If the question is where to build a life, continue with our where to live guide. If belonging is the central issue, the Home Line page follows that question further.
Generate my map before comparing cities05 / What the example cannot settle
Precise-looking lines still have limits.
Read the full astrocartography chart example PDFSource: the project’s synthetic New York sample report, dated July 14, 2026, and its published Orlando map and reading. No customer birth data is used.
In this astrocartography chart example, five signals change in the report’s ±5 minute birth-time test, described as moderately sensitive. That gives a specific reason to qualify precise conclusions when the starting time is uncertain; it does not establish an error range for everyone or prove that the city rankings change.
Placidus and Whole Sign relocated houses give the same direction of interpretation in the sample, with affected signals in two places. This agreement provides context for the confidence judgment above, while the mixed verdicts retain the actual support and pressure.
The comparison covers five cities, not every possible destination. An absent city has not been rejected. Calculated geography and astrological interpretation also answer different questions: neither measures job availability, visas, housing costs, or a partner’s preferences. Keep these practical constraints alongside the reading when deciding whether to test a move.
Questions about the example
Read the sample. Keep your own question.
What does an astrocartography chart example show?
It connects a calculated world map to nearby signals, a place reading, and a comparison. Here, Orlando leads overall, Winnipeg leads for Home, and Akureyri leads for career. Each result retains its cautions, showing what changes when the person’s priority changes.
Is this a real calculation or an invented map?
This astrocartography chart example is calculated from synthetic birth details: June 15, 1990, 08:15 in New York. The maps, distances, and city conclusions come from the published demonstration report, linked as a PDF. They are not customer results.
Why does the example include both support and caution?
Orlando’s Jupiter–ASC signal contributes growth and exploration, while Neptune–DSC adds relationship caution. The report keeps both in the place reading. Even its high-confidence Home verdict remains mixed: confidence describes the evidence behind a conclusion, rather than making the conclusion entirely supportive.
Are the dashed lines ordinary AC, DC, MC, or IC lines?
In the demonstration maps, dashed lines mark 60°, 90°, or 120° aspects to angles. Moon–ASC 120° is therefore an aspect line. Map legends can differ: the interactive generator uses dashed lines for DSC / IC. Follow each map’s own legend and labels.
Can I use this astrocartography chart example to choose my city?
Its cities illustrate how a judgment is formed. Your birth details produce different lines and distances, so bring your current city and a realistic candidate to your own map. Compare them against the goal that could change your decision, keeping the supporting evidence and cautions together.
Can I generate my own map for free?
Yes. The form generates your personal map here. Free city checks, complete reports, deeper readings, and full comparisons retain the product’s existing access and credit limits; see Pricing for what is included. The demonstration PDF is a sample, not a newly generated personal report.
What if my birth time is uncertain?
You can explore an estimated map. Five signals change in this astrocartography chart example’s ±5 minute test, so the exact-looking map still needs context. Your uncertainty may differ. Complete personal reports require an accurate birth time; precise distances should not outweigh uncertain starting data.
From their sample to your places
What would change on your map?
Use this astrocartography chart example to ask a more personal question: “What supports my goal in this city, and what comes with it?” Start with your birth date, time, and birthplace, then bring your present city or a realistic candidate to the generated result. Keep the supporting evidence and the trade-off in the same decision.
Generate my personal map